September 17, 2019
Thank you for reading this post, don't forget to subscribe!Keeping an eye out for issues that affect your app’s stability is crucial, but we also know that you can’t spend your entire day staring at the Firebase Crashlytics console.
From the beginning, Crashlytics has given developers the ability to turn on stability alerts so they can be notified when issues increase in impact and severity. Developers have the power to customize these notifications so they’re delivered at the right time and channel for maximum visibility – channels where developers already spend their time.
In this blog post, we’ll review the types of alerts Crashlytics provides and our recommendations on how to configure them based on observations from customers.
Types Of Alerts
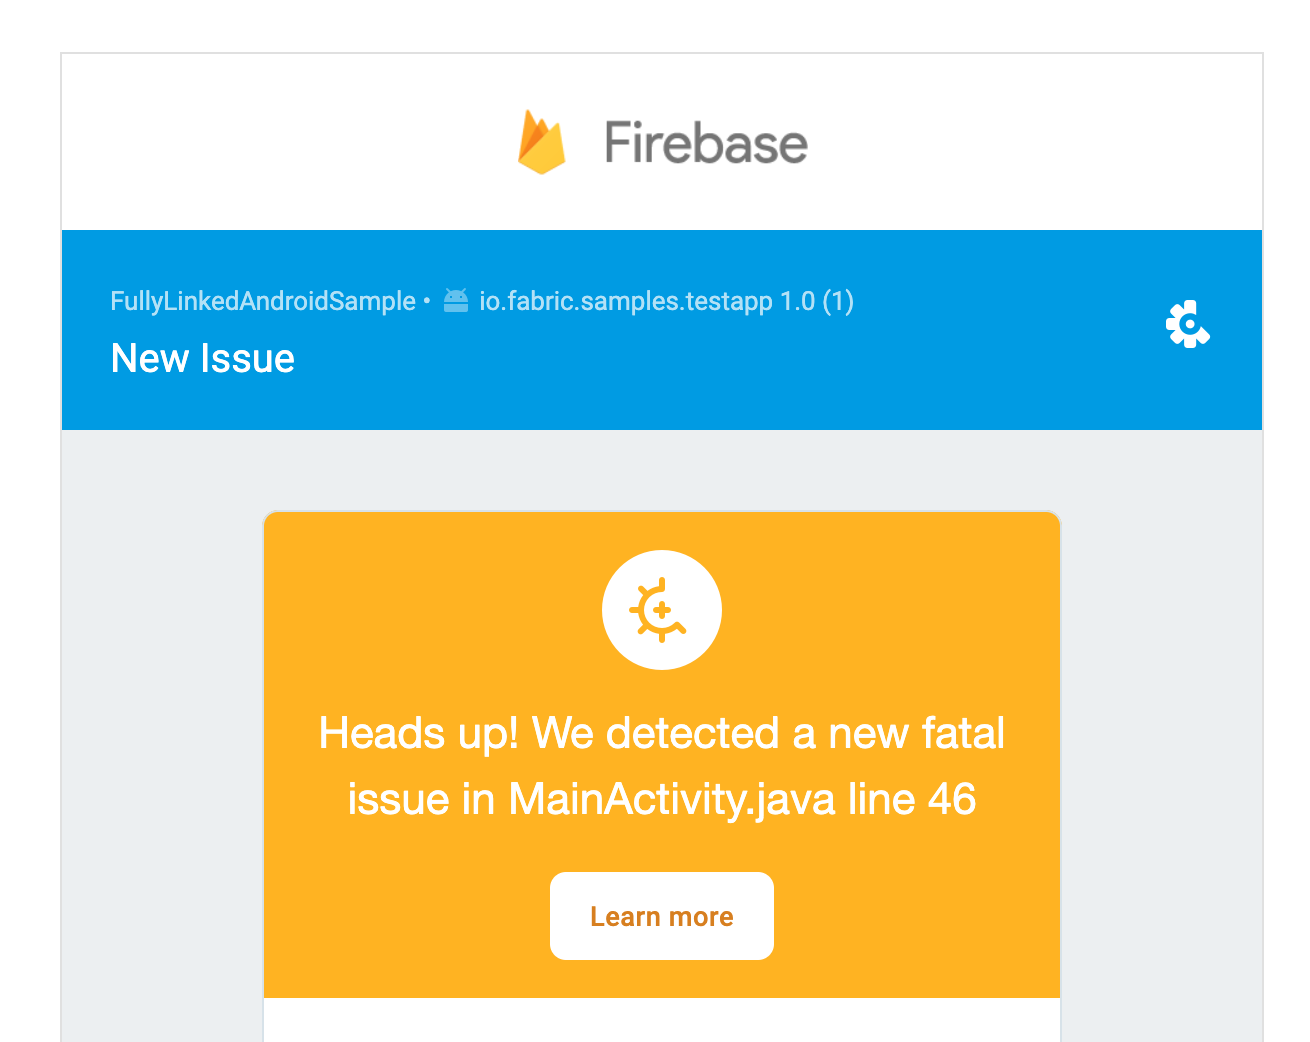
Let’s start by reviewing the different types of alerts Crashlytics sends. Currently, Crashlytics sends five alerts: new fatal issue, new non-fatal issue, trending issues, regression, and velocity alerts.
New issue alerts
New issue alerts let you know the first time a new crash has occurred. We filter out the noise of repeated crashes, but give you the full stream of unique crashes by stack trace grouping. These alerts are turned off by default to avoid over inundating you, because as your app grows, you could get tons of alerts for every new version. We recommend turning these on for teams interested in knowing about every new type of crash, and for QA teams chasing down crashes found in testing versions of their apps.
Regression detection alerts
Regression detection alerts you when a previously closed issue re-occurs in a new app version, which is a signal that something else may be awry and you should pay close attention to it.
Trending issues digest
Trending issues digest is sent out to developers in two instances 1) When Crashlytics detects a new crash is beginning to gain momentum (called emerging issues) 2) When Crashlytics detects new top crashes that have climbed to close to the top of your issue list recently (called trending issues). This daily email is on by default, and is a great way to keep track of emerging issues in your app.
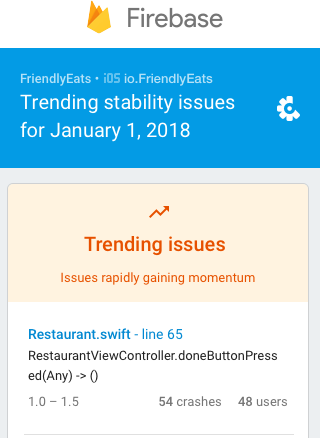
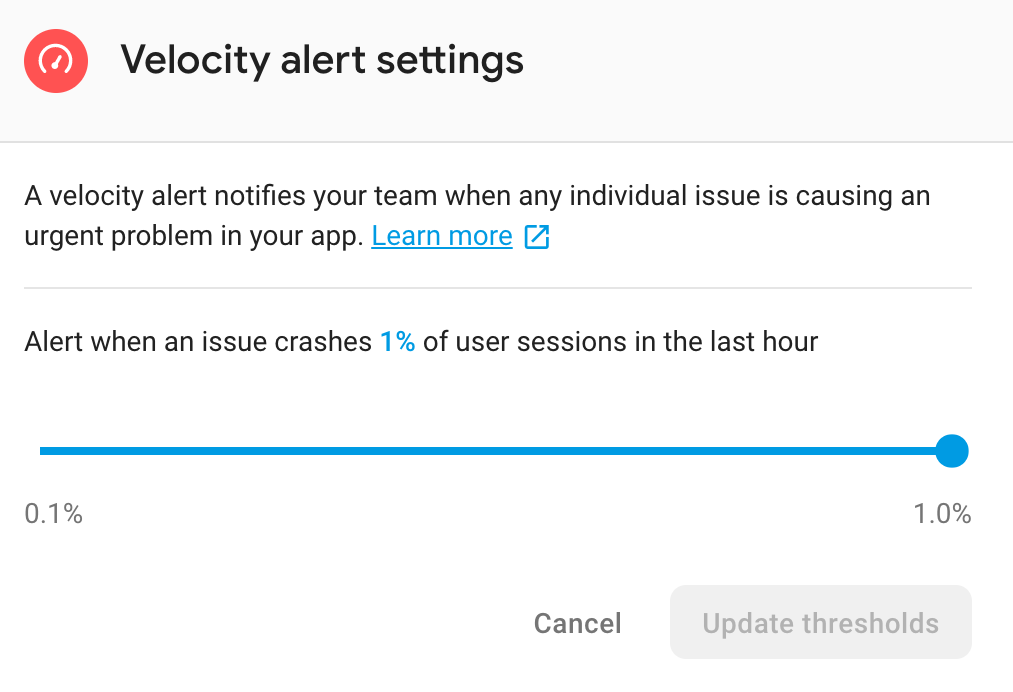
One of the most important alerts within Crashlytics is the velocity alert, which notifies you when an issue suddenly increases in severity and impacts a significant percentage of your users. However, we recognize that every app is unique and the one-size-fits-all alerting threshold might not be what’s best for you and your business. That’s why you can now customize velocity alerts and determine how often and when you want to be alerted about changes to your app’s stability.
You can learn more about customizing velocity alerts here.
Now that you know the different notification types in Crashlytics, you can begin to build your alerting plan.
Choosing your channels
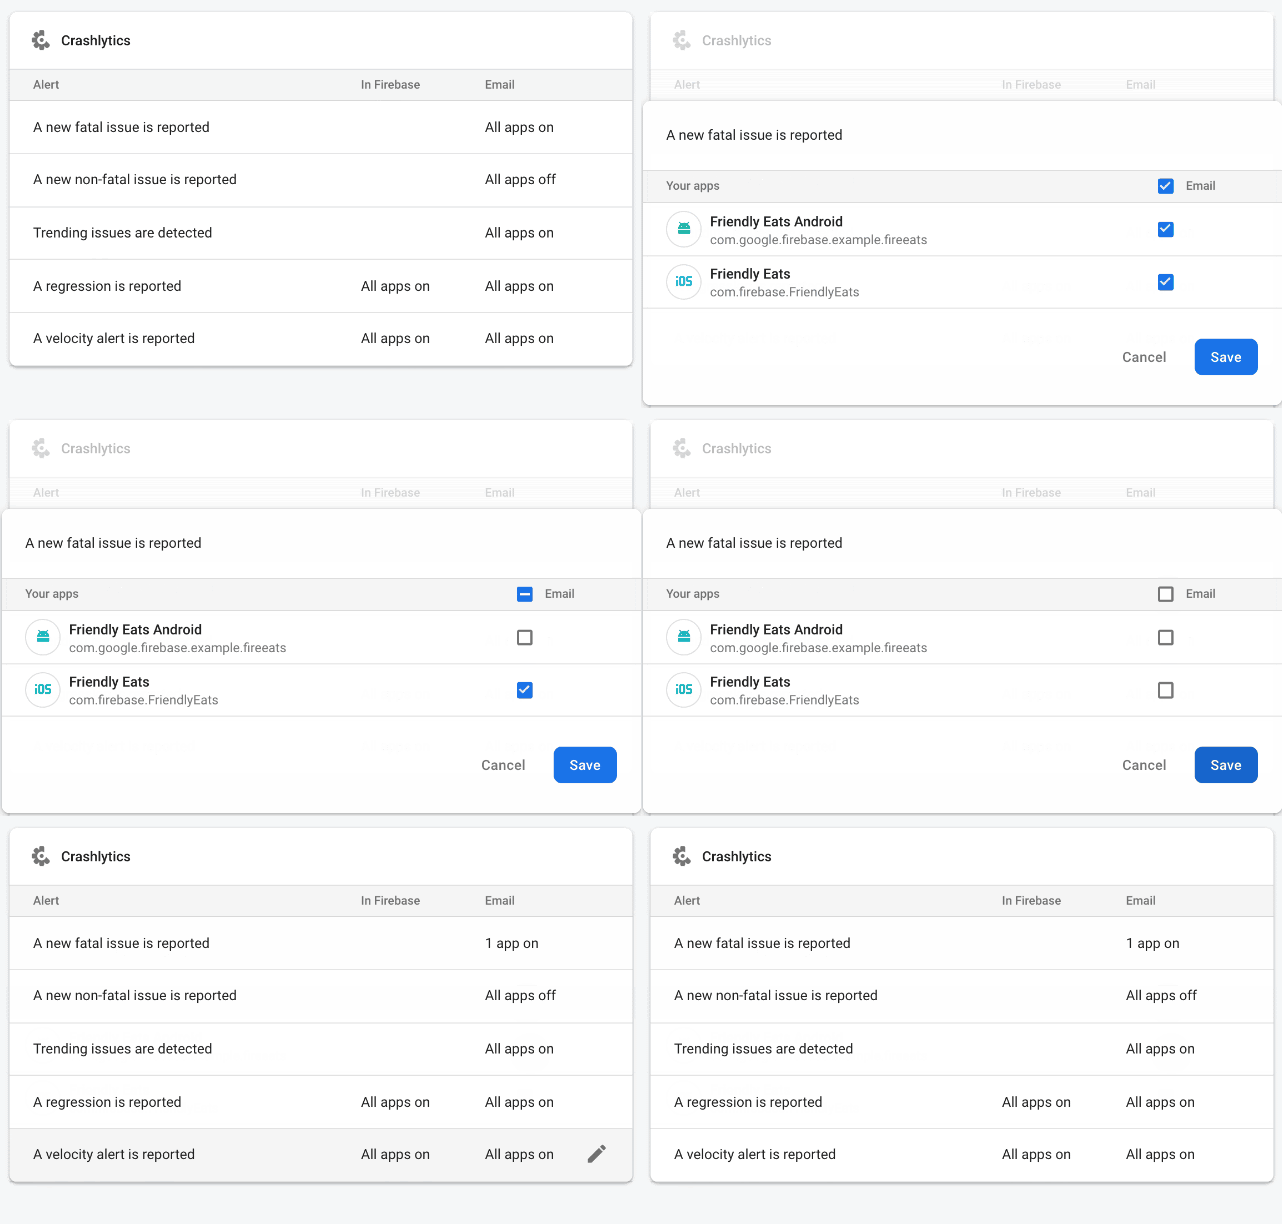
Firebase Crashlytics offers several channels to receive the above alerts. The first two channels are email and in-console alerts.
Setting up alerts
To setup these alerts:
- Click 🔔 Firebase alerts in the upper-right corner of the Firebase console
- Click the gear icon ⚙️ for settings
- Choose the project that you want to receive email alerts for
- Check relevant boxes to choose whether you’d like alerts in the Firebase Console, over email, or both
Next, you can set up notifications through Slack, Jira or PagerDuty. To set up these alerts, you need to do two things: integrate Slack / Jira / PagerDuty with your Firebase project, and then choose your triggers.
Slack:
-
Navigate to your project settings and click into the Integrations tab
-
Next, setup your Slack connection by providing a webhook URL, a channel name, and a username for posting
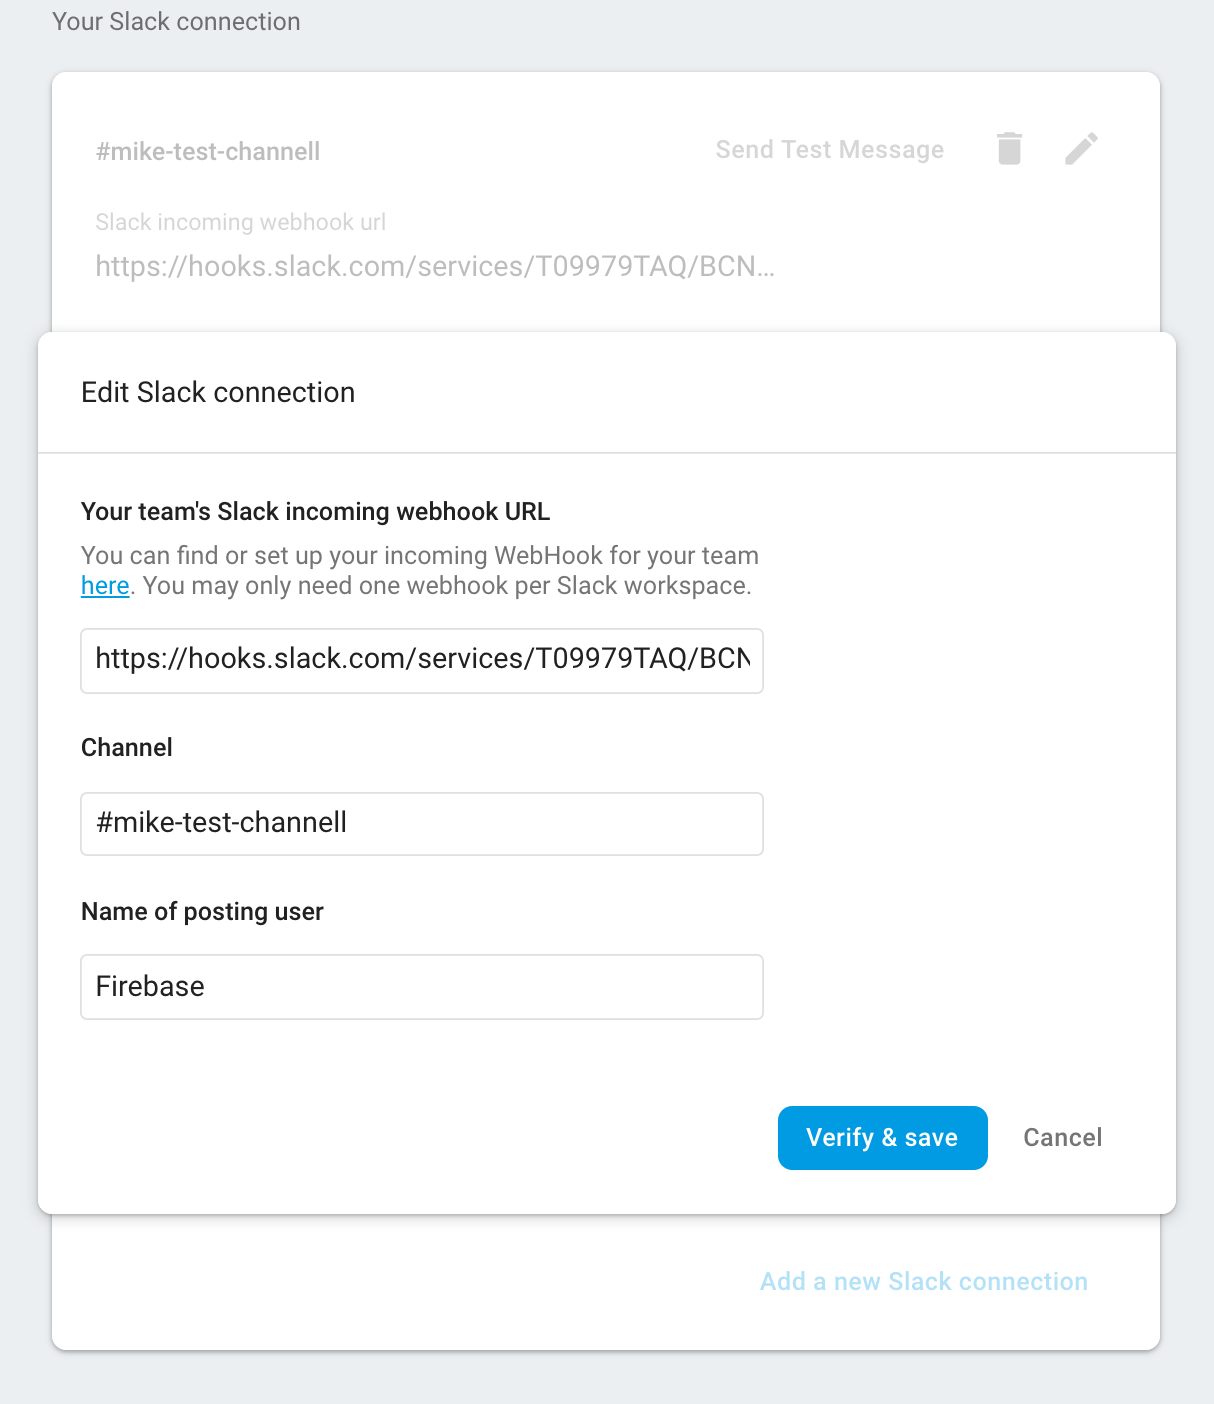
image of slack connection configuration -
Finally, choose your triggers. You can get notifications for new fatals and non-fatals as well as regressed issues and velocity alerts
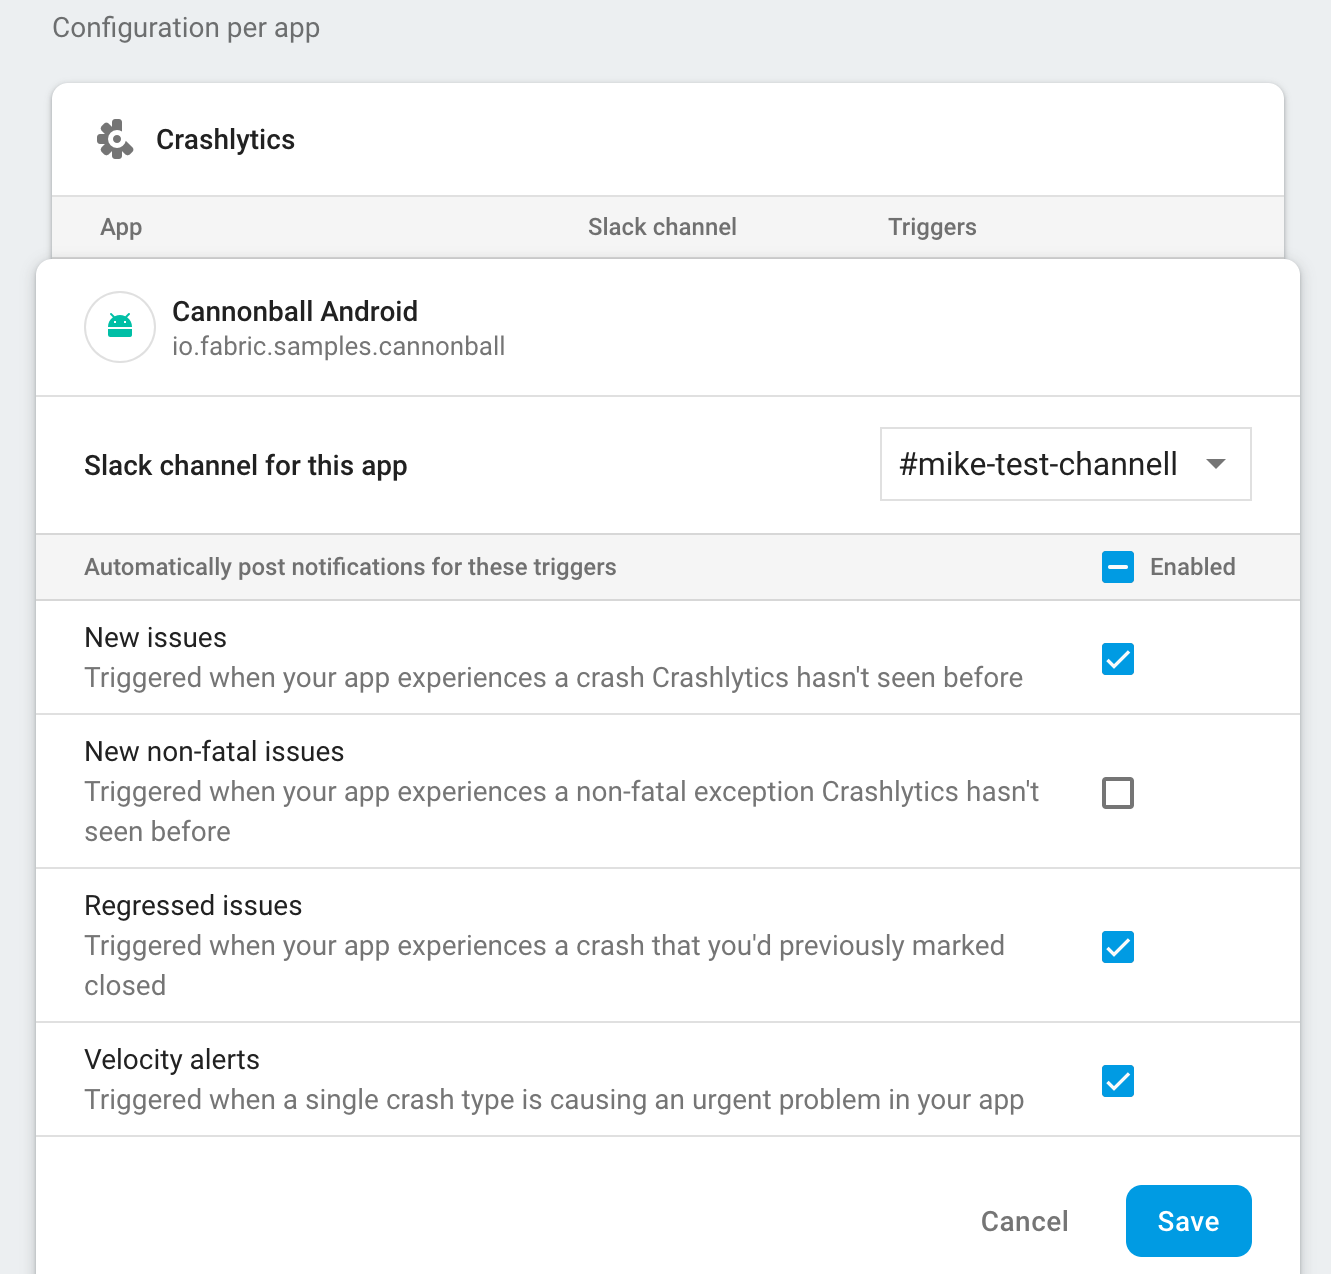
image slack app configuration
Jira
There are two ways to create Jira issues from Crashlytics issues:
- Automatic issue creation. Firebase can create Jira issues in response to Crashlytics events such as new Issue, regressed issues and velocity alerts
- You can create new Jira tickets for a Crashlytics issue, by clicking a button on the Crashlytics console
Here’s how you enable the Jira integration:
- Navigate to the Crashlytics issue you’d like to link to a Jira issue
- Click Link to Jira
- Either click Create issue in Project, or paste your Jira issue URL or issue key in the space below
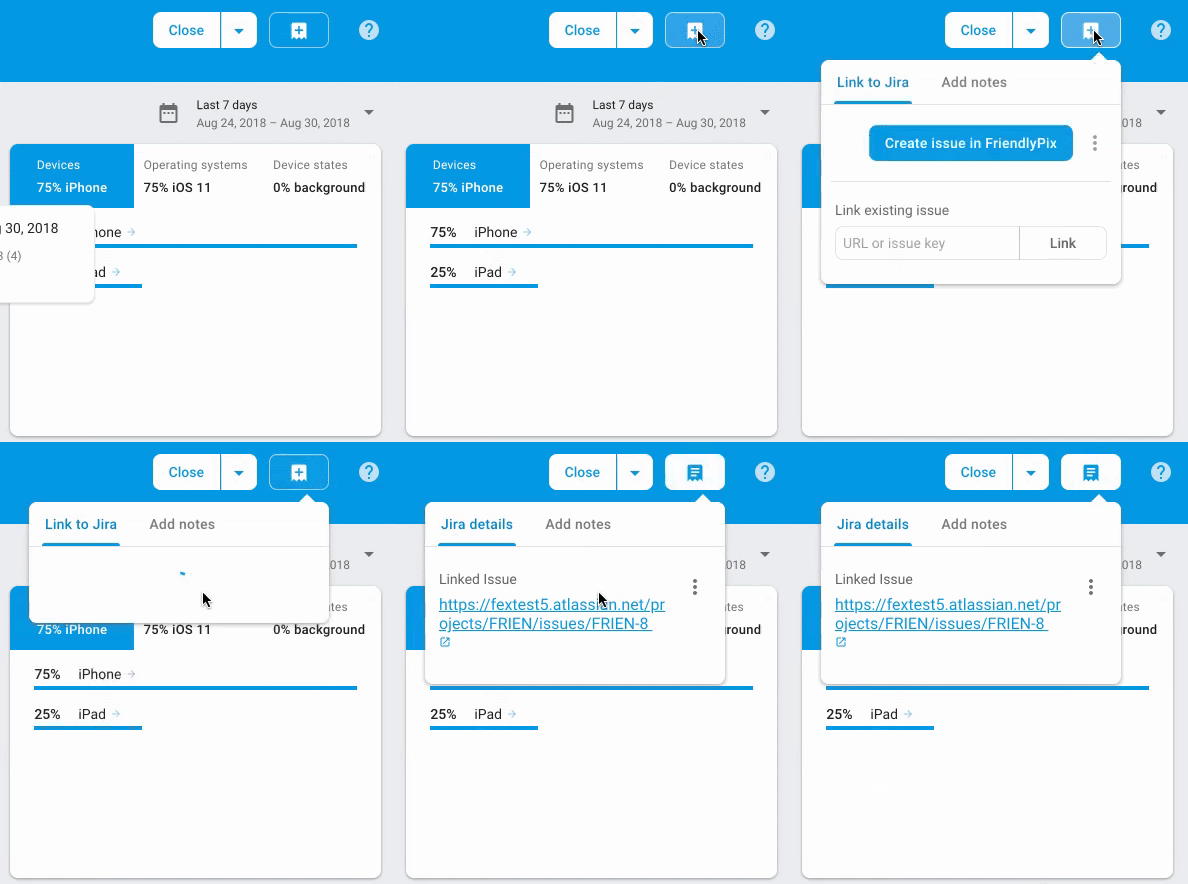
Our PagerDuty integration is setup similarly.
Recommendations based on how customers use them
We find that a lot of our users get different utility out of each channel. In Slack, teams frequently set up a channel to show a real-time feed of all new issues, as a way to loosely monitor new issues coming up. Developers with an interest in specific pieces of code can then click through to get more detail on the issues they’re interested in. This is a pattern that seems to work well for most teams.
Jira
In Jira, we see developers using the manual integration option to create issues when they know their team is ready to take on that work. In addition, teams also setup automatic triggers for velocity alerts and regressions as those are known higher priority issues to look into.
And for PagerDuty, most teams focus on velocity alerts, which provide insight into the most critical situations your users are experiencing. For teams with even more custom use cases, we recommend developers integrate Crashlytics with Cloud Functions.
Check out the docs
By setting up alerting in Crashlytics, you can rest assured that you’ll be alerted when critical issues occur in your app and be ready to take action when needed. For more about Crashlytics check out our docs here.
2019-09-17 00:00:00


